National deficit
27 April 2011The Office of National Statistics' report on Public Sector Finances for the financial year ending March 2011 is finally available. The good news is that overspending is below predictions. The bad news is that it is still massive, and if nothing is done about it the UK will be the next Greece.
Deficit vs. debt
Much of the anti-cuts material I have seen, in addition to using incorrect figures, also routinely mixes up both deficit and debt. Deficit is how much overspend there is in a given time-frame, and debt is cumulative overspend. Unless qualified, deficit refers to current deficit, as historical (i.e. previous years') deficit as something distinct from debt is rarely of genuine interest. Although the banking bail-outs results in the UK's national debt going from on of Europe's smallest to its largest, this will (in the ideal case) be recovered fairly quickly once the banks are returned to the private sector. Because of this the UK still enjoys historically low loan servicing costs.Bail-outs are not the cause of current deficit
A regular favourite of socialists is to claim that the deficit is mostly due to banking bail-outs. One problem: It's wrong. Although the banking bail-outs were huge, the resultant borrowing was concentrated in 2008, and hence contributed to 2008's overspend. Since the bailed-out institutions are now entirely on the public accounts, and their assets were bought out at distressed (i.e. undervalued) prices, total borrowing as a result of banking bail-outs has actually reduced. Put another way the current 'deficit' as a result of the banking bail-outs is actually a surplus:
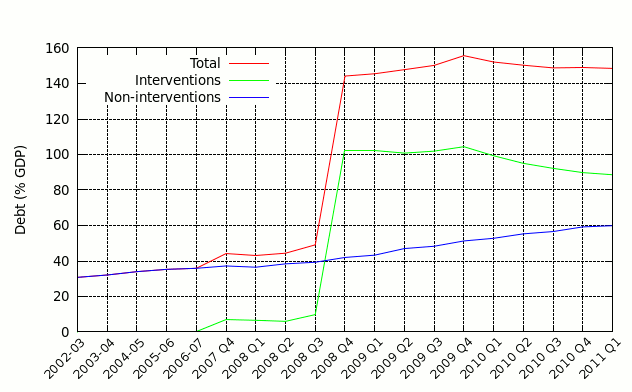
The problem is the blue line, which is debt caused by underlying overspending. In the 6 financial years between 2002 and 2008 it went from circa 30% to circa 40% (1.6% a year), and since the start of the 2008-09 financial year it has gone from 40% to 60% (6.7% per year). I personally think that tax revenues are not going to return to pre-crunch levels, and hence the 6.7% deficit implied by the blue line since 2008 is what our structural deficit will be for the foreseeable future. However I will consider the optimistic 1.6% case, as it saves me the need to justify why increased spending is not going to go down naturally.
The structural deficit
Excluding effects from financial interventions, the UK's deficit for 2010-2011 was £141bn, which is equivalent to 9.4% of GDP. Put another way the government spent £3.91 for every £3; raised. However for arguments sake, I will assume the best case scenario that revenues and expenditure will return to pre-2008 levels. Since the 5 years before the credit crunch were clearly a time when the country was doing well, I will consider the average overspend of those years as the structural deficit. That average was £36billion per annum.Lets put that into perspective. To offset that by tax rises alone would require one of:
- VAT increased to 25%
- VAT raised (Table PSF3) £96.5bn last financial year, which would have been £93.3bn if rise to 20% had not taken place. Assuming (big assumption) a linear relationship between VAT rate and revenue, each 0.5% increase gets an extra £2.6bn.
- Petrol/diesel prices increased by 81p/litre.
- The 2010 UK Energy Brief gives petrol & diesel consumption as 15.9 and 20.0 megatons respectively, which works out as 21,000 and 23,000 mega-litres. £36bn spread over 44bn litres works out as 81.8p extra per litre. This corresponds to a 68.1p increase in fuel duty, as VAT is charged on the whole price per litre after duty is added.
- Three times total annual University spending
- Almost the entire defence budget
- Almost four times the entire cost of the Iraq war
- 24 times the post-invasion annual cost.